Getting Reliable Site Maps from Drone Photogrammetry: Key Checks
Drone surveys produce a huge amount of raw imagery, but what you really need is a usable map or a 3D model. The process that turns those overlapping photos into accurate site data is photogrammetry, and at its heart is the creation of a drone point cloud. If any step in the processing chain is off, the final point cloud will have errors that ripple into every derived product.
This article walks through the main points to verify when processing photogrammetric data so you end up with a site map that you can trust for measurements, volume calculations, or design work.
Check Your Image Quality Before You Start
No amount of clever software can fix bad source photos. The first quality gate is the raw imagery itself. Blurry images, motion blur from fast shutter speeds that are still too slow, or uneven exposure across a flight line all degrade the automatic tie-point matching that photogrammetry relies on. A quick visual scan of a representative sample of images is worth the time. Look for sharp edges on objects like building corners or rock faces. If the images are soft across the whole set, the resulting drone point cloud will be noisy and less precise.
You should also verify that the images have consistent brightness. A sudden change in cloud cover during a flight can create strips of darker images that confuse the alignment algorithms. Most processing software can handle some variation, but extreme shifts often lead to mismatched points and holes in the point cloud.
Confirm Overlap Settings
Photogrammetry works by finding common points in overlapping images. If the overlap is too low, the software has few points to triangulate from, and the geometry becomes weak. Standard practice calls for at least 75 percent front overlap and 60 percent side overlap for terrain mapping. For complex structures or tall vegetation, you might need higher numbers.
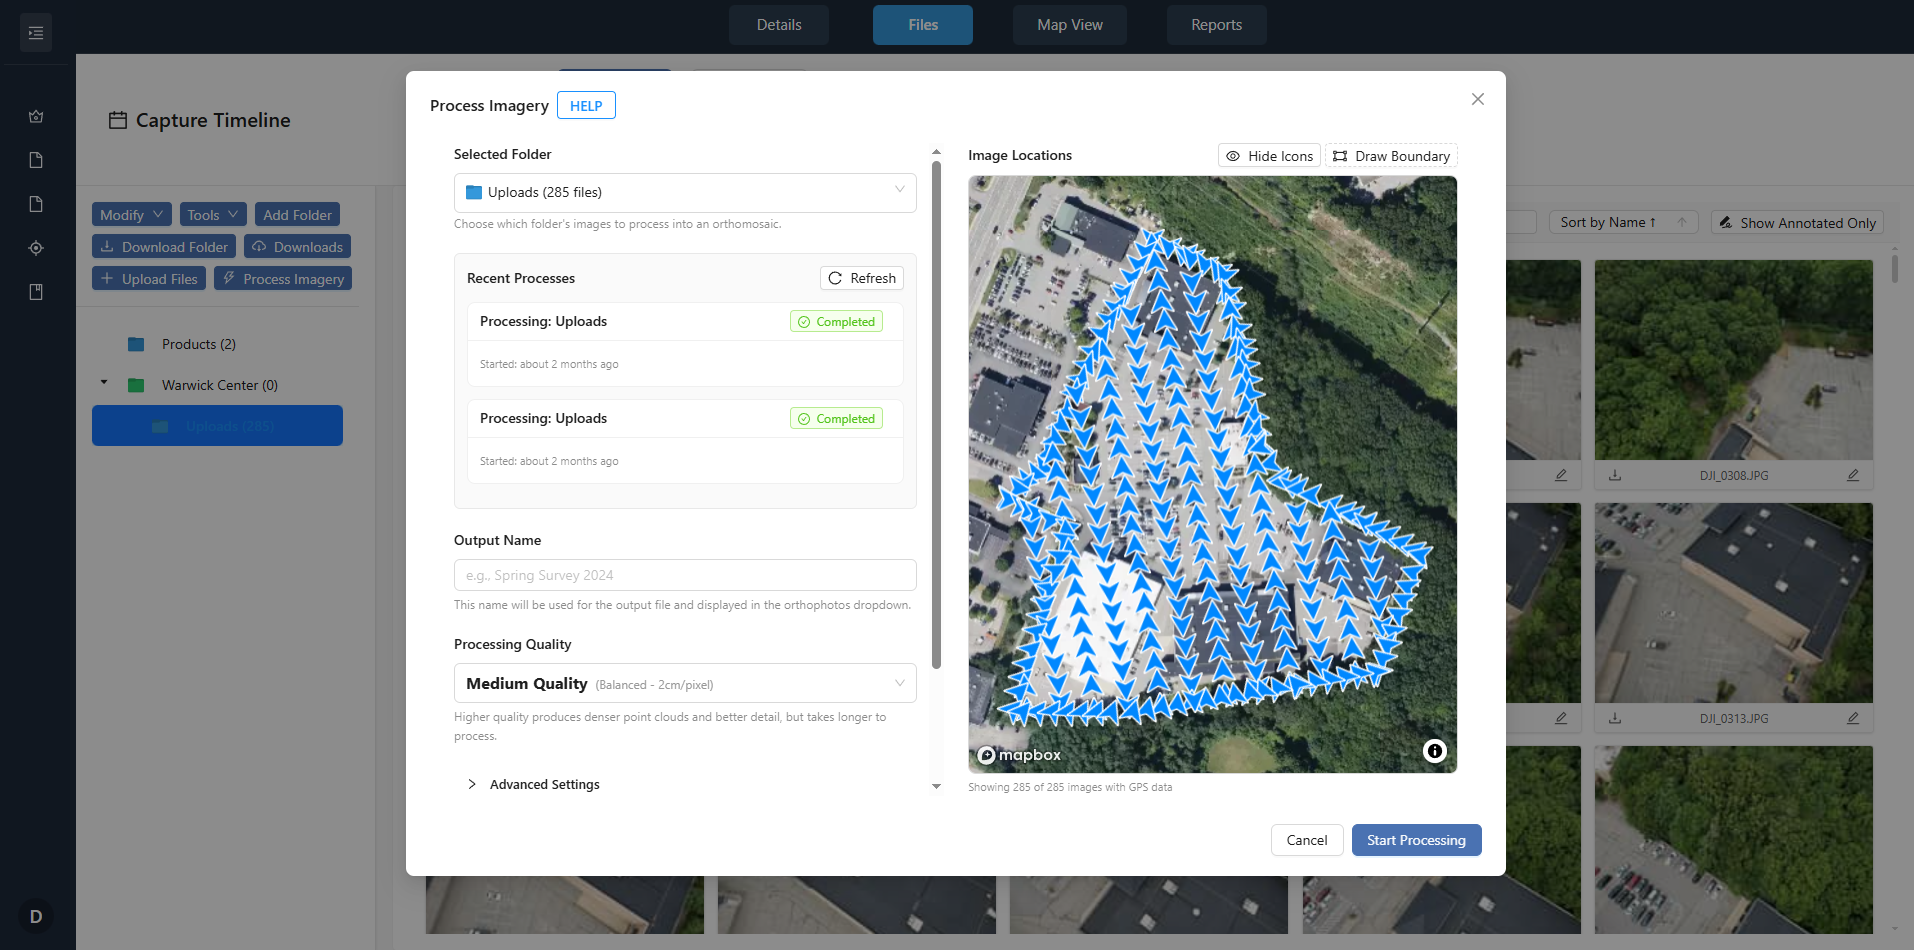
Before you load images into your processing pipeline, check the flight log or mission plan to confirm the overlap percentages. If the flight was flown manually without a planned grid, inspect the image sequence for gaps. A gap in coverage means the point cloud will have a void in that area, and you will not know until you try to generate the orthomosaic or digital surface model.
Verify Ground Control Points and Checkpoints
Even with perfect image overlap, the resulting drone point cloud floats in a relative coordinate system unless you anchor it with ground control points (GCPs). These are physical markers on the ground whose positions are measured with survey-grade GNSS equipment. The processing software uses GCPs to transform the relative model into real-world coordinates.
At least three well-distributed GCPs are the minimum for a small site, but more is better for larger areas. Place them at the corners and the center of the site, not in a straight line. After processing, use independent checkpoints, markers that were not used in the adjustment, to evaluate accuracy. If the checkpoints show residuals larger than your project tolerance, something in the alignment or camera calibration needs attention.
Examine the Camera Calibration File
Every camera lens distorts light slightly. A calibration file corrects for radial distortion, decentering distortion, and the principal point offset. If the calibration is wrong or missing, the photogrammetric software will compute incorrect ray intersections, and the point cloud will have systematic errors that look like a curved surface.
When you start a new project, confirm that the calibration file you are using matches the camera and the focal length used during the flight. Some processing platforms let you run a self-calibration using the images themselves, but that approach is less reliable than a factory or lab calibration. For the most accurate mapping, use the calibration that came with the camera or from a recognized calibration service.
Choose the Right Coordinate System and Georeferencing Settings
Project coordinate systems matter for two reasons. First, the output must align with existing site plans or cadastral data. Second, if you plan to combine the drone point cloud with other survey data, all datasets need the same coordinate reference system. A mismatch here can shift the entire point cloud by meters, especially if you are working with a projected system like UTM and the GNRS data uses geographic coordinates.
During processing, specify the coordinate system that matches your GCPs and the final deliverables. Many software tools let you reproject after processing, but it is cleaner to set it at the start. Also check the geoid model if you need orthometric heights rather than ellipsoidal heights. The difference can be tens of meters in some regions.
Assess Ground Sampling Distance Early
Ground sampling distance (GSD) is the distance between pixel centers measured on the ground. It dictates the level of detail in the orthomosaic and the point cloud. A GSD of 2 cm means each pixel covers a 2 cm square on the ground. If your project requires identifying objects smaller than that, the GSD is too coarse.
You can calculate expected GSD from flight altitude, camera sensor size, and focal length before you fly. After the flight, check that the actual GSD in the processed images matches the plan. If the terrain has large elevation changes, the GSD will vary across the site. In steep areas, consider flying at a constant height above ground rather than a constant altitude above sea level.
Inspect the Point Cloud for Noise and Artifacts
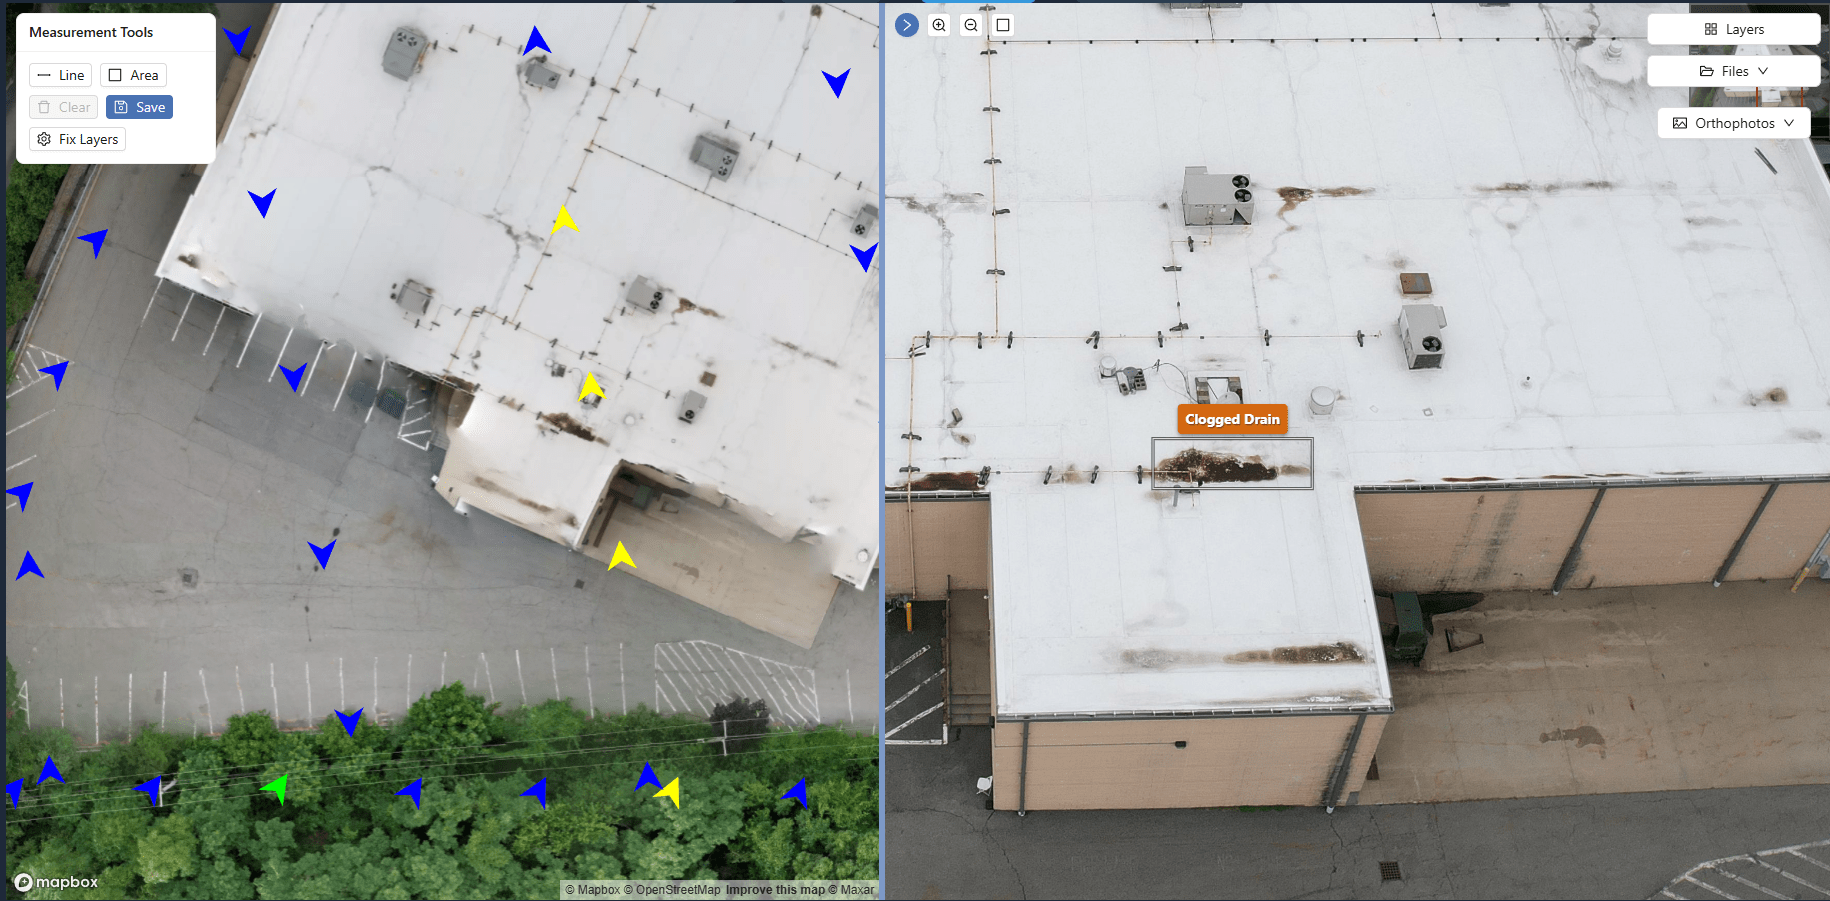
Once the processing software has aligned the images and computed the three-dimensional points, you have a raw drone point cloud. Before you export it for further use, inspect it visually. Look for stray points that float above the ground, often caused by dust, birds, or moving vehicles. Also look for holes where the algorithm could not find matches, usually in uniform surfaces like water, smooth asphalt, or dense shadows.
Most photogrammetry tools offer a noise filter or a point classification step. Use it to remove low-confidence points and to classify vegetation separately from ground points. For a site map, you want a clean ground surface. Vegetation points will confuse volume calculations and contour generation.
One use of the phrase "turning flight photos into maps" comes in the middle of this process: after you have filtered noise and classified points, you are effectively turning flight photos into maps by assigning each point a geographic coordinate and an elevation. The quality of that transformation depends entirely on the steps above.
Validate the Orthomosaic and Digital Surface Model
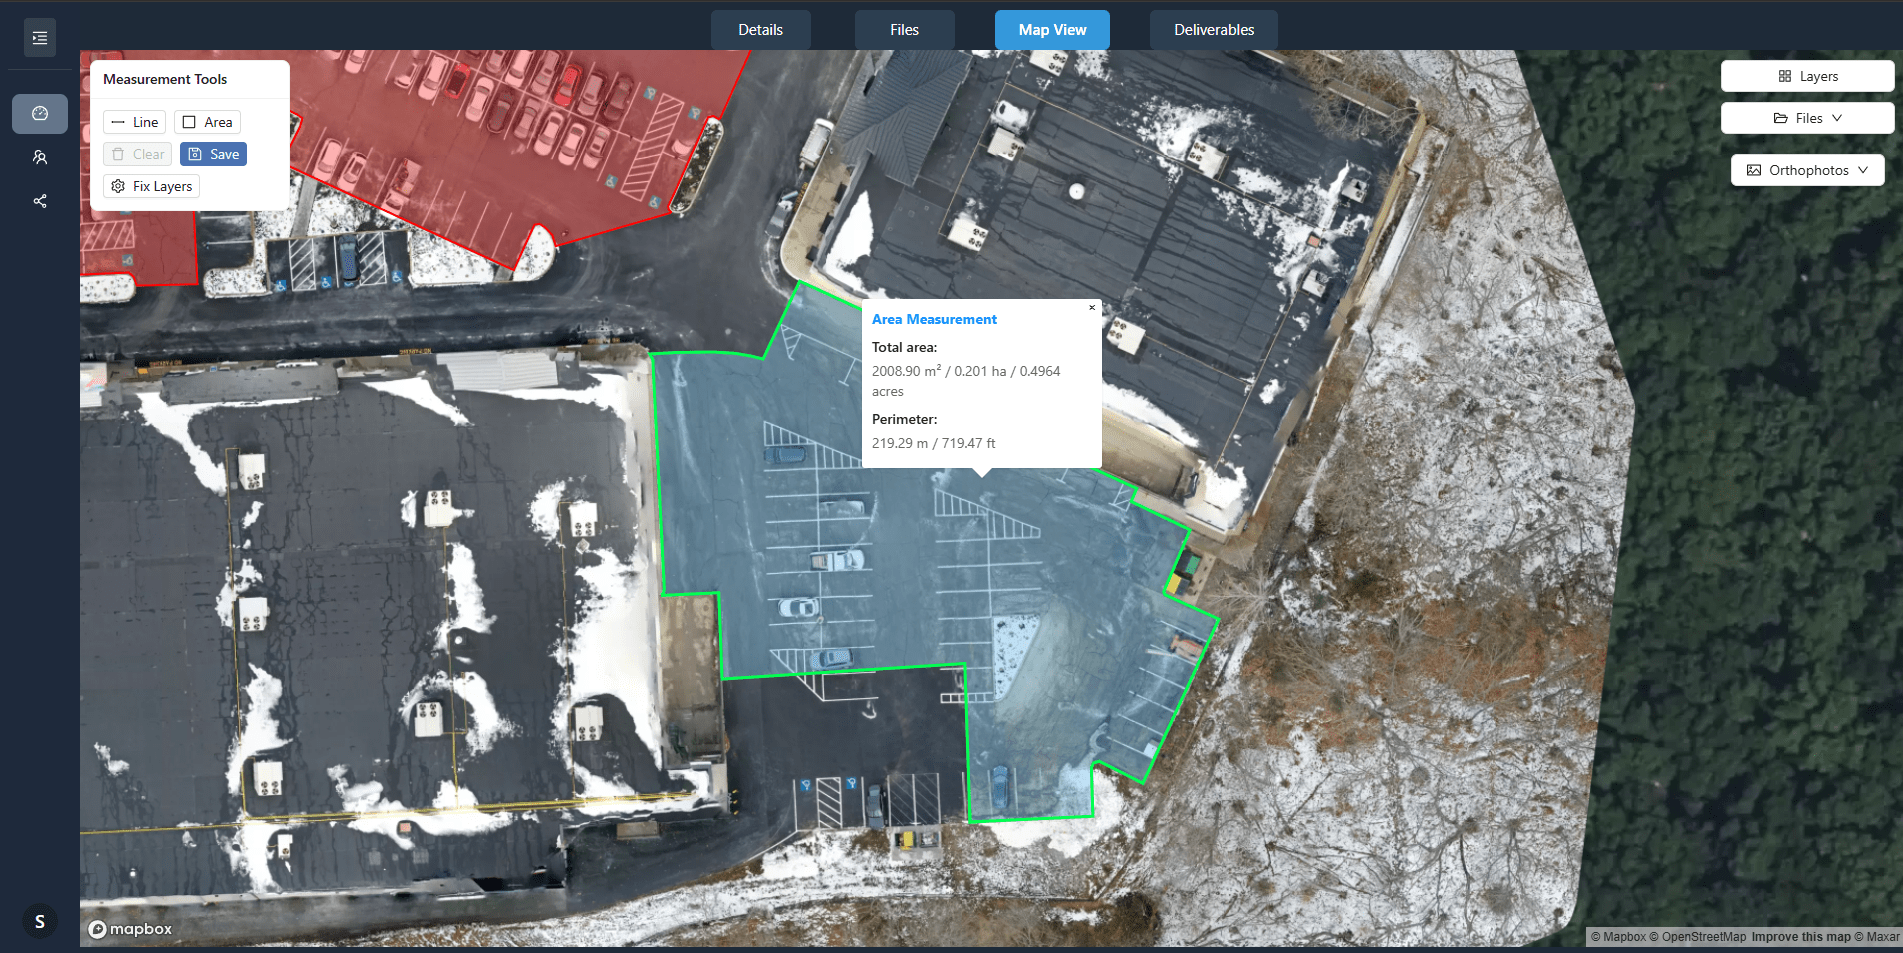
The orthomosaic is a rectified, seamless image of the site, and the digital surface model (DSM) is the elevation surface that includes buildings and vegetation. Both are derived from the point cloud. Check the orthomosaic for visible seams where images were stitched together. Seams indicate poor color balancing or misregistration. A good orthomosaic should look like a single large photo with no abrupt changes in tone or offset edges.
For the DSM, compare its elevation values to known points on the ground. If you have checkpoints, plot the difference. A systematic bias suggests the GCPs or camera calibration need review. Random high errors often point to unfiltered vegetation or moving objects in the scene.
Review Processing Logs for Warnings
Modern photogrammetry software logs every step. These logs contain warnings about poorly matched tie points, images that failed to align, or high reprojection errors. Do not ignore them. A warning about a high percentage of failed tie points might mean your overlap was too low or the images are too featureless. A warning about large residuals on a GCP means that GCP might have been measured incorrectly or the marker moved.
Reviewing the logs is a quick way to catch problems before you invest time in further analysis. If the logs show a consistent error pattern, you can adjust parameters and reprocess rather than accepting a flawed output.
Test Consistency Across Multiple Processing Runs
If your project demands high reliability, process the same dataset twice with slightly different settings, for example, different keypoint extraction thresholds or different point density settings. Compare the two resulting point clouds. They should agree within your project tolerance. Large discrepancies indicate that the processing pipeline is sensitive to parameter choices, and you need to understand why.
This kind of test is especially important when the drone point cloud will be used for cut-and-fill volume calculations, where a small vertical error translates into many cubic meters of material. A second, independent processing run acts as a validation of the first.
The second use of the phrase "turning flight photos into maps" is relevant here: at the end of a thorough validation, you have confidence that the software is reliably turning flight photos into maps, and you can deliver the data to your client or use it for your own analysis.
Processing drone photogrammetry data is a chain of decisions and checks. Skip one, and the final map may look plausible but contain hidden errors. By following a systematic checklist, from image quality and overlap through GCPs, calibration, coordinate systems, GSD, noise filtering, and validation, you reduce the risk of delivering a drone point cloud that is not fit for purpose. The goal is not just to produce a map, but to produce a map you can defend.